Table of Contents
Context: The Ministry of Commerce released quick trade estimates.
Insights of Trade Of India 2023-24

- Exports: Total Exports: Total merchandise and services exports reached a record high of $200.3 billion in the Q1 of 2024-25.
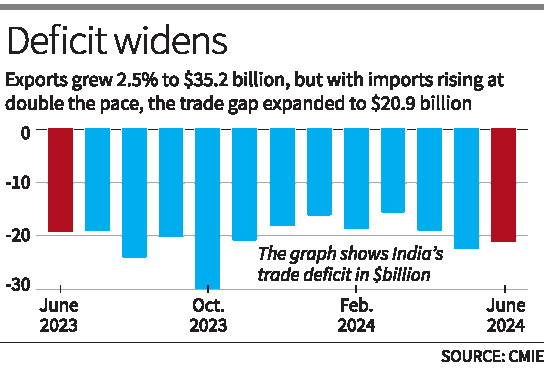
- Merchandise Export: Rising by 2.55% year-on-year to $35.2 billion.
- Services Exports: Pegged at $30.3 billion for the last month, an 8.9% increase from a year ago.
- 2023-24: Total exports hit a record $778.2 billion, up 0.42% from the previous year.
- Imports: Rose by 5% to $56.2 billion.
- Trade Deficit: Widened by 9.4% year-on-year (YoY).
| Fact |
| A 2.8% increase in exports is needed to reach the $800 billion target, though geopolitical risks present challenges. |
- June’s goods exports and imports were the second highest in 10 years, after June 2022’s $42.3 billion in exports and $64.35 billion in imports.
Key Growth Drivers
- Engineering goods: +10.3%
- Electronics goods: +16.9%
- Drugs and pharmaceuticals: +9.9%
- Chemicals: +3.3%
- Coffee: +70%
Trade during June 2024
| June 2024
(USD Billion) |
June 2023
(USD Billion) |
||
| Merchandise | Exports | 35.20 | 34.32 |
| Imports | 56.18 | 53.51 | |
| Services* | Exports | 30.27 | 27.79 |
| Imports | 17.29 | 15.61 | |
| Total Trade
(Merchandise +Services) * |
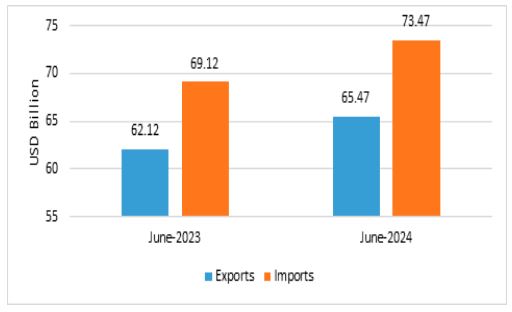
Exports | 65.47 | 62.12 |
| Imports | 73.47 | 69.12 | |
| Trade Balance | -8.00 | -7.00 |

Petroleum Trade
- Exports: Petroleum exports fell by 18.3% to $5.5 billion in June.
- Imports: Petroleum imports rose by 19.6% to $15.05 billion.
- Oil Deficit: Improved from a peak deficit of $13.2 billion in May, as noted by QuantEco Research economists.
| About Trade Deficit |
Potential Causes of Trade Deficit
|


 100 Years of CPI: Origins, Ideology, Fre...
 Santhali Language: History, Script, Cons...
 Why India Needs Its Own Economic Model?


