Table of Contents
Context: The National Sample Survey Office recently released a detailed report based on the Household Consumption Expenditure Survey (HCES) for 2022-23.
More in News
- The report includes unit-level data on household consumption expenditure (HCE).
- The HCES collected data on the quantities of various food items consumed by households and the total value of consumption of different food and non-food items.
- This analysis converts the quantities of consumed food items into their total calorific value.
- Additionally, it compares the estimated per capita per day calorie intake of household members in lower expenditure classes with the average per capita daily calorie requirement for a healthy life.
Approach of Measurement
Defining the ‘poor’: In India, various committees have defined the poor as persons below the ‘poverty line’ (PL).
- Lakdawala Committee (1993): Anchored the PL and poverty line basket (PLB) to calorie norms of 2,400 kcal per day for rural areas and 2,100 kcal per day for urban areas.
- Tendulkar Committee (2009): Did not anchor PL to calorie norms.
- The committee computed new poverty lines for rural and urban areas of each state based on the uniform poverty line basket and found that all of India’s poverty lines (2004-05) were:
- ₹446.68 per capita per month in rural areas
- ₹578.80 per capita per month in urban areas
- The committee computed new poverty lines for rural and urban areas of each state based on the uniform poverty line basket and found that all of India’s poverty lines (2004-05) were:
- Rangarajan Committee (2014): Based the PL on adequate nourishment, clothing, house rent, conveyance, education, and other non-food expenses.
| Did you Know? |
|
Measuring Nutritional Levels
The methodology involves for Measuring Nutritional Levels:
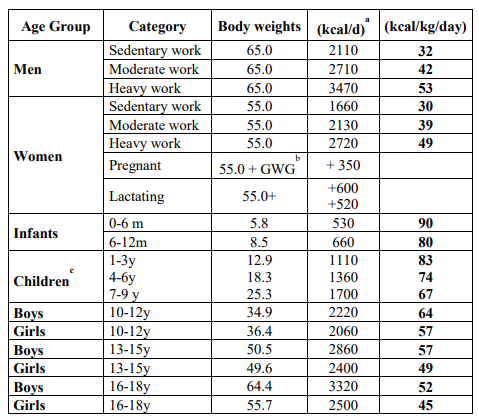
- Average Daily Per Capita Calorie Requirement (PCCR) Calculation: Derived from the recommended energy requirements for Indians of different age-sex-activity categories, according to the latest (2020) report of ICMR-National Institute of Nutrition.
- PCCR is calculated as a weighted average of calorie requirements for these categories, using weights based on the proportion of estimated persons in these categories from the Periodic Labour Force Survey, 2022-23.
- Classification and Calculation of MPCE: Estimated persons are arranged into 20 fractile classes of MPCE (poorest to richest), each representing 5% of the population.
- For each class, the average per capita per day calorie intake (PCCI) and average MPCE (food and non-food) are derived using data from HCES 2022-23.
- The average MPCE on food, linked to the PCCR, represents the minimum amount needed for a household to maintain a healthy life.
- Derivation of Total MPCE Threshold: The average per capita expenditure on food is combined with the average MPCE on non-food items for the poorest 5% to derive the total MPCE threshold (at average all-India prices).
- This threshold is adjusted for price differentials across States/UTs using the general Consumer Price Index numbers to determine the corresponding State/UT-specific total MPCE thresholds.
- Determining Proportion of ‘Poor’/Deprived: The proportion of ‘poor’/deprived at the State/UT level is calculated as the proportion of persons below the total MPCE thresholds.
- The national proportion of ‘poor’/deprived is derived as the weighted average of the State/UT-wise proportions, with weights based on the projected populations of the States/UTs as of March 1, 2023, according to the July 2020 report of the National Commission on Population.
- Calorie Intake Estimation: Approximations are used to derive calorie intake figures at the household level in cases where HCES data reports aggregate quantity figures for grouped items.
What are the Key Findings of the Report?
- Per Capita Calorie Requirement (PCCR): 2,172 kcal for rural India and 2,135 kcal for urban India.
- All-India Threshold Total MPCE (2022-23 prices):
- Rural: ₹2,197 (food: ₹1,569; non-food: ₹628).
- Urban: ₹3,077 (food: ₹2,098; non-food: ₹979).
- Proportion of ‘Poor’/Deprived:
- Rural: 17.1%.
- Urban: 14%.
- Threshold Total MPCE with Non-Food Expenditure of Poorest 10%:
- Rural: ₹2,395.
- Urban: ₹3,416.
- Proportion of Deprived:
- 2% for rural India
- 4% for urban India.
- Nutritional Deficiency: Average per capita per day calorie intake (PCCI) of the poorest 5% and the immediately above 5%:
- Rural: 1,564 kcal and 1,764 kcal.
- Urban: 1,607 kcal and 1,773 kcal.
| Other Estimates of Poverty in India |
NITI Aayog Discussion Paper: ‘Multidimensional Poverty in India since 2005-06’:
Multidimensional Poverty Index (MPI) 2023:
|
 World Population Day 2025, Themes, Histo...
 Special Intensive Revision (SIR) in Biha...
 List of Military Exercises of India 2024...