Table of Contents
Context: A report by the Reserve Bank of India (RBI) on municipal finances highlighted the rise in tax revenue share in recent years.
- Theme: “Own Sources of Revenue Generation in Municipal Corporations: Opportunities and Challenges.”
- The first edition was published two years ago.
Revenue Generation Breakdown
In FY24, municipal corporations are projected to generate their revenue from various sources:
- Own Taxes, Fees, and User Charges: 50%
- Revenue Grants from Central and State Governments: 25%
- Other Sources: The remaining portion includes rental income, compensations, and investment income.

| Sources of Revenue of Municipal Corporation in India |
|
Short-Term Revenue Comparison (FY24 vs. FY20)
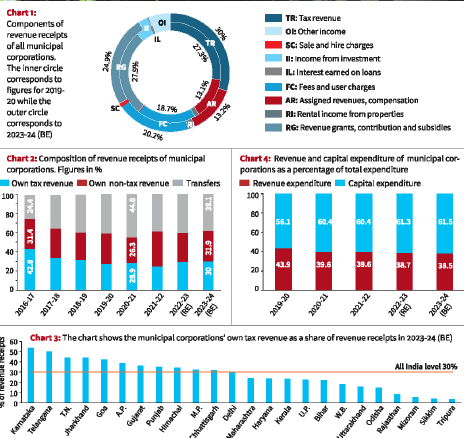
- Own Tax Revenue: Increased from 27.3% to 30%
- Fees and User Charges: Rose from 18.7% to 20.2%
- Revenue Grants, Contributions, and Subsidies: Decreased from 27.9% to 24.9%
- Compensations and Rental Income: Remained stable at 13% and 6%, respectively.
- Interest and Investment Income: Constituted about 1-2% of total revenue in both periods.
This data indicates a growing ability of municipal corporations to raise their own revenue while decreasing reliance on government grants.
Long-Term Revenue Comparison (FY24 vs. FY17)
- In FY17, own tax revenue constituted 43% of total revenue; this has significantly dropped to only 30% in FY24.
- Conversely, the share of transfers from Central and State governments has increased, indicating a long-term decline in self-generated revenue capabilities post-GST.
State-wise Own Tax Revenue
- In FY24, the highest own tax revenue generation was reported in:
- Karnataka: 53.8%
- Telangana: 50.3%
- Tamil Nadu: 44.3%
- Jharkhand: 44.0%
- States such as Rajasthan, Odisha, and Uttarakhand reported the lowest ratios.
Expenditure Quality Improvement
The quality of expenditure among municipal corporations is showing improvement:
- The share of revenue expenditure decreased from 43.9% in 2019-20 to 38.5% in 2023-24 (BE).
- Correspondingly, capital expenditure increased from 56.1% to 61.5%, indicating a shift towards more productive spending.


 Out-of-Pocket Health Expenditure, Reason...
 Treasury Bills (T-bills): RBI Cuts Holdi...
 Fisheries Sector in India, Current Statu...


