Table of Contents
Context: In 2023, India surpassed China as the world’s most populous country.
Background
- China’s birth rate is declining (6.4 births per 1,000 people) and its total fertility rate is around 1%. It recorded negative population growth for the first time in six decades, indicating a rising dependency ratio.
- India’s population has reached replacement levels (total fertility rate of 2.1) and is expected to peak around 2060.
- These demographic changes have significant implications for domestic consumption in both countries.

Private Final Consumption Expenditure (PFCE)
- PFCE is a measure of total consumption expenditure by households and non-profit institutions serving households on goods and services.
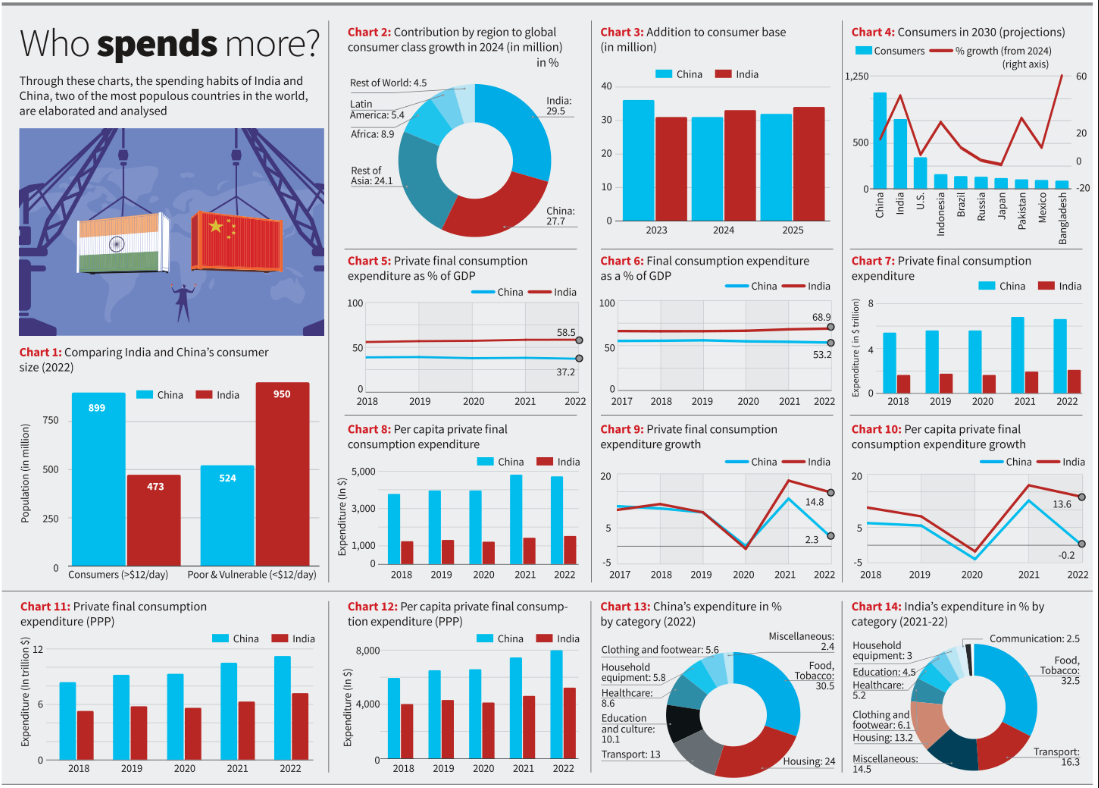
- As a percentage of GDP, India spends significantly more on consumption than China (58% vs 38%).
- Final consumption, which includes government consumption expenditure, constitutes 68% of GDP for India and 53% for China.
- Despite China’s economy being approximately five times bigger than India’s, its PFCE is only about 3.5 times that of India’s.
- China’s PFCE has registered a significant increase in the past four years, while India’s figures have steadily increased from $1.64 trillion in 2018 to $2.10 trillion in 2022.
- In 2022, China recorded a decline in its numbers, both aggregate and per-capita, while India witnessed marginal growth in both categories.
- India’s PFCE has closed the gap with China from ~3.3 to ~3.1 in terms of ratio.
- In per capita PFCE, China widened the gap marginally from ~3.0 times of India in 2018 to ~3.1 in 2022.
Purchasing Power Parity (PPP)
- PPP figures are used to account for differences in the cost of living between countries.
- In PPP terms, China’s PFCE is approximately 1.5 times that of India.
- The relative gap between China and India widened from ~1.58 in 2018 to ~1.66 in 2020 and 2021, but 2022 witnessed India closing the gap to ~1.55.
- In 2022, India added a trillion dollars to its consumption expenditure (PPP) despite a worsening exchange rate.
Expenditure by Categories
- India spends more on food, clothing, footwear, and transport, and less on education, culture, recreation, and healthcare, typical of a developing market.
- China’s consumption basket represents a relatively developed market, with a declining percentage of expenditure on food and beverages.
- China spends more on housing, white goods, recreation, education, and healthcare than India.
- In aggregate terms, India spends about half of what China spends on food, transport, communication, and clothing.
- India’s real growth rate in these categories often outperformed China’s nominal growth rates.
Conclusion
The increase in India’s consumer spending could potentially make it more attractive to foreign businesses, especially within the China+1 strategy context. However, whether this appeal enhances India’s status as a preferred destination over competitors remains uncertain.


 GPS Spoofing and Its Impact in India: A ...
 Amrit Gyaan Kosh Portal: A Comprehensive...
 UpLink Initiative: Launched by World Eco...


