Table of Contents
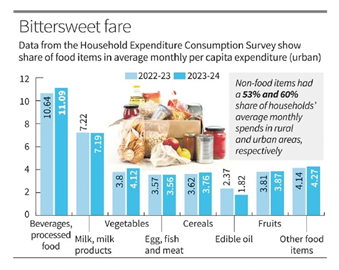
Context: As per the Household Consumption Expenditure Survey (HCES), India’s average household consumption spending on a per capita basis rose about 3.5% in real terms from August 2023 to July 2024 from the previous year.
What is Household Consumer Expenditure Survey (HCES)?
- Conducted By: National Statistical Office (NSO) under the Ministry of Statistics and Programme Implementation (MoSPI).
- Frequency: Quinquennial (recurring every five years).
Objectives
The primary purpose of HCES is to collect information on the consumption of goods and services by households. This data is crucial for estimating various economic indicators such as:
- Monthly Per Capita Consumption Expenditure (MPCE).
- Poverty levels across different demographics.
- Updates to the Consumer Price Index (CPI) and Gross Domestic Product (GDP) calculations
Highlights of HCES 2023-24

| Aspect | Details |
| Rising Food Expenditure |
|
| Urban-Rural Expenditure Gap | Gap narrowed to 69.7% (2023-24) from 71.2% (2022-23), showing stronger growth in rural consumption spending over the decade. |
| Average Monthly Consumption Expenditure (MPCE) |
|
| Income Distribution & Spending Trends |
|
| Consumption Inequality (Gini Coefficient) |
|
| Sectoral Breakdown of Expenditure |
|
| State-Wise Consumption Patterns |
|


 Serious Fraud Investigation Office (SFIO...
 Article 142 of Indian Constitution, Sign...
 Pakistan-Occupied Kashmir (PoK): History...


