Table of Contents
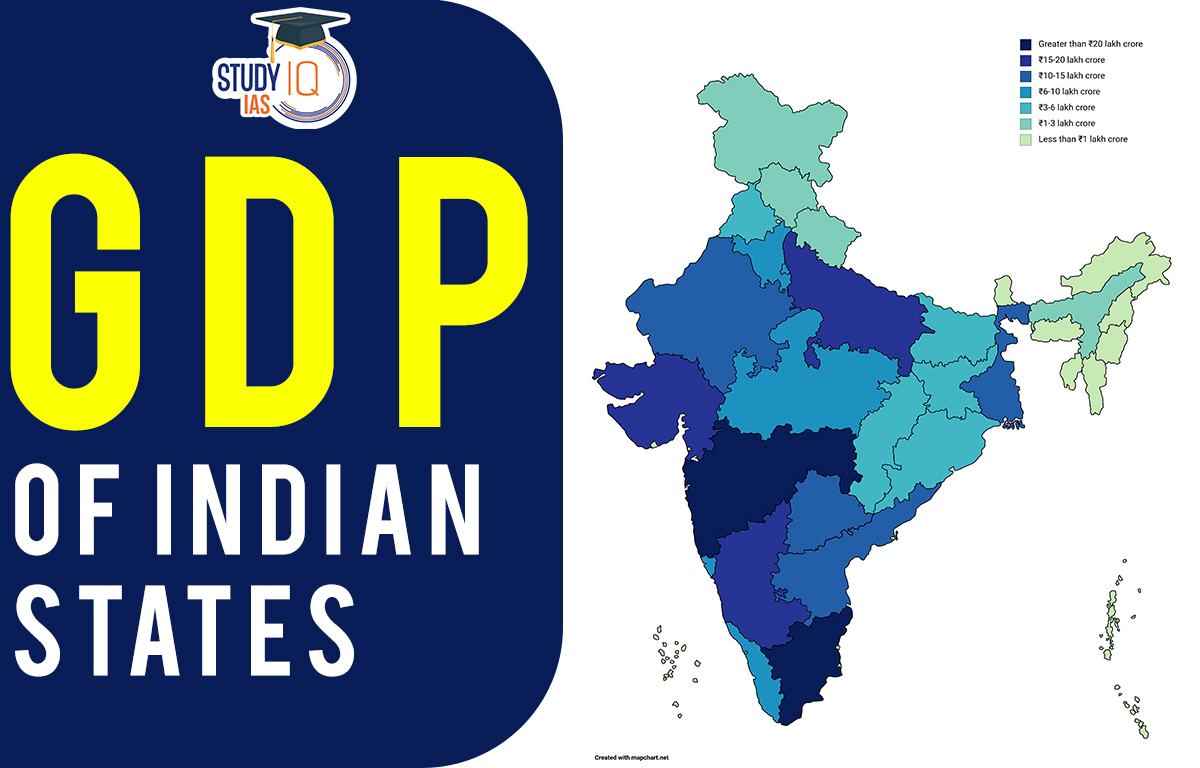
India is a diverse country with different states having varying levels of economic development. The GDP of Indian states is a dynamic and ever-changing landscape, with some states witnessing rapid growth while others face challenges. Top 3 Largest Economies (as of Q2 FY 2023-24, provisional estimates):
- Maharashtra: ₹32.39 lakh crore
- Uttar Pradesh: ₹29.53 lakh crore (Recent surge, surpassing Tamil Nadu)
- Tamil Nadu: ₹28.51 lakh crore
GDP of India as per Economic Survey 2022-23
The Economic Survey 2022-23 predicts that India’s GDP Growth Rate is expected to be between 6.0% to 6.8% in 2023-24, subject to the trajectory of global economic and political developments.
Top 10 GDP States in India 2024
The total nominal GDP of India for Q2 FY 2023-24 is estimated to be ₹322.39 lakh crore. These percentages show the relative contribution of each state to the national economy. Some states, like Uttar Pradesh and Andhra Pradesh, are experiencing fast GDP growth rates, potentially causing their percentage share to increase in the future. Here’s a breakdown of the nominal GDP of Indian states as a percentage of the total Indian GDP, based on provisional estimates for Q2 FY 2023-24 (latest available data).
- Maharashtra: 15.7%
- Uttar Pradesh: 9.2%
- Tamil Nadu: 9.1%
- Gujarat: 8.2%
- West Bengal: 7.5%
- Karnataka: 6.2%
- Rajasthan: 5.5%
- Andhra Pradesh: 4.9%
- Madhya Pradesh: 4.6%
- Telangana
Uttar Pradesh State become 2nd largest Economy in India
Uttar Pradesh has recently surpassed Tamil Nadu to become the second-largest economy in India as per a report by prominent online blogging platform soic.in, which keeps track of investments and the stock market. This is a remarkable achievement for the UP state, marking a significant step forward in its economic development journey. UP has also surged from 14th to 2nd place in the Ease of Doing Business Ranking.
Key Factors of Uttar Pradesh’s Economic Growth
- Focus on infrastructure development: The state government has been actively investing in infrastructure projects like roads, highways, railways, and airports, improving connectivity and attracting businesses.
- Industrial promotion: Uttar Pradesh has implemented various policies and initiatives to attract investments in sectors like manufacturing, food processing, pharmaceuticals, and textiles. This has led to the establishment of several industrial clusters and Special Economic Zones (SEZs).
- Skill development: The state government is focusing on skilling its workforce to meet the demands of the growing industries. This is being done through various training programs and skill development initiatives.
- Tourism promotion: Uttar Pradesh is rich in historical and cultural heritage, with Taj Mahal being a prime example. The state government is actively promoting tourism, which is creating jobs and boosting the local economy.
GDP of Indian States 2023-24
Here is a compilation of the Net State Domestic Product at Current Prices (2011-12 Series) categorized by states. Check the complete GDP of India Statewise in the given table:
| S. No | State | 2019-20 | 2020-21 | 2021-22 |
| 1 | Andhra Pradesh | 874402 | 917920 | 1085625 |
| 2 | Arunachal Pradesh | 27536 | 29354 | NA |
| 3 | Assam | 311031 | 303016 | NA |
| 4 | Bihar | 533234 | 533583 | 614431 |
| 5 | Chhattisgarh | 307995 | 312532 | NA |
| 6 | Goa | 67354 | 67075 | NA |
| 7 | Gujarat | 1437478 | 1459229 | NA |
| 8 | Haryana | 687996 | 683810 | 808030 |
| 9 | Himachal Pradesh | 136083 | 135190 | 150866 |
| 10 | Jharkhand | 282924 | 271839 | 304903 |
| 11 | Karnataka | 1467522 | 1575400 | 1870429 |
| 12 | Kerala | 742223 | 718034 | 811517 |
| 13 | Madhya Pradesh | 854702 | 881530 | 1061297 |
| 14 | Maharashtra | 2408482 | 2393953 | NA |
| 15 | Manipur | 28353 | 30866 | NA |
| 16 | Meghalaya | 31222 | 30791 | 33690 |
| 17 | Mizoram | 18437 | 17463 | NA |
| 18 | Nagaland | 26528 | 26923 | NA |
| 19 | Odisha | 467925 | 462358 | 571793 |
| 20 | Punjab | 478916 | 471074 | 516142 |
| 21 | Rajasthan | 898081 | 914262 | 1078903 |
| 22 | Sikkim | 27522 | 27778 | 32133 |
| 23 | Tamil Nadu | 1564831 | 1617931 | 1845519 |
| 24 | Telangana | 864105 | 868926 | 1041617 |
| 25 | Tripura | 48728 | 48527 | 57589 |
| 26 | Uttar Pradesh | 1494889 | 1425330 | 1614798 |
| 27 | Uttarakhand | 211374 | 207289 | 225097 |
| 28 | West Bengal | 1100651 | 1186857 | NA |
| 29 | Andaman & Nicobar Islands | 8742 | NA | NA |
| 30 | Chandigarh | 38934 | 35216 | NA |
| 31 | Delhi | 713549 | 702519 | 836162 |
| 32 | Jammu & Kashmir-U.T. | 135139 | 137397 | 162926 |
| 33 | Puducherry | 33266 | 32006 | 33806 |
GDP of Indian States Per Capita
Here is a list of the per capita GDP of Indian States based on the Per Capita Net State Domestic Product at Current Prices (2011-12 Series).
| S. No | State | 2019-20 | 2020-21 | 2021-22 |
| 1 | Andhra Pradesh | 169320 | 176707 | 207771 |
| 2 | Arunachal Pradesh | 182240 | 192360 | NA |
| 3 | Assam | 90123 | 86857 | NA |
| 4 | Bihar | 44230 | 43605 | 49470 |
| 5 | Chhattisgarh | 105089 | 104943 | NA |
| 6 | Goa | 435949 | 431351 | NA |
| 7 | Gujarat | 212428 | 212821 | NA |
| 8 | Haryana | 240507 | 235707 | 274635 |
| 9 | Himachal Pradesh | 185728 | 183333 | 201854 |
| 10 | Jharkhand | 75016 | 71071 | 78660 |
| 11 | Karnataka | 222002 | 236451 | 278786 |
| 12 | Kerala | 213041 | 205067 | 230601 |
| 13 | Madhya Pradesh | 103103 | 104894 | 124685 |
| 14 | Maharashtra | 196100 | 193121 | NA |
| 15 | Manipur | 82437 | 87832 | NA |
| 16 | Meghalaya | 87653 | 84638 | 90638 |
| 17 | Mizoram | 153902 | 144394 | NA |
| 18 | Nagaland | 122759 | 123385 | NA |
| 19 | Odisha | 103512 | 101501 | 124669 |
| 20 | Punjab | 154385 | 149894 | 162112 |
| 21 | Rajasthan | 115356 | 115933 | 135218 |
| 22 | Sikkim | 412627 | 412754 | 472543 |
| 23 | Tamil Nadu | 206165 | 212174 | 241131 |
| 24 | Telangana | 231378 | 231103 | 275443 |
| 25 | Tripura | 121456 | 119789 | 140803 |
| 26 | Uttar Pradesh | 65666 | 61666 | 68810 |
| 27 | Uttarakhand | 188441 | 182698 | 196282 |
| 28 | West Bengal | 113163 | 121267 | NA |
| 29 | Andaman & Nicobar Islands | 219653 | NA | NA |
| 30 | Chandigarh | 328002 | 292977 | NA |
| 31 | Delhi | 356151 | 344136 | 401982 |
| 32 | Jammu & Kashmir-U.T. | 101891 | 102803 | 121000 |
| 33 | Puducherry | 217138 | 206888 | 214913 |
Highest GDP State in India 2024
Maharashtra has the highest GDP in India, contributing about 15.7% to the country’s overall GDP. The State has a strong presence in sectors like manufacturing, finance, and services, which diversify its economy. Its capital city, Mumbai, is the financial capital of India and home to several prominent financial institutions and industries. The state government has implemented several policies and initiatives to promote business and investment, making it a popular destination for domestic and international investors. Maharashtra has also attracted significant foreign investment and a robust infrastructure network, contributing to its economic growth.
Lowest GDP State in India
Bihar is one of the lowest GDP states in India with a contribution of only about 3.1% to India’s overall GDP. The state has struggled with poverty, unemployment, and underdeveloped infrastructure, which has hindered its economic growth. The majority of the state’s population is engaged in agriculture, which is largely dependent on the monsoon season. The Bihar state government has implemented several measures to promote economic development, including attracting investment, developing infrastructure, and promoting entrepreneurship. Despite the challenges, Bihar has shown some signs of improvement in recent years, with increased investment in sectors like manufacturing, tourism, and renewable energy.
GDP of Indian States Affecting Factors
The GDP of Indian states is influenced by a complex interplay of various factors. Understanding these factors can provide valuable insights into the economic landscape of different regions. Here are some key elements that affect state GDPs:
- Factors such as natural resources, infrastructure, human capital, and government policies contribute to a state’s economic growth.
- States with strong manufacturing, service, and financial sectors tend to have a higher GDP than those that rely primarily on agriculture.
- GDP growth can also be influenced by external factors such as global economic and political developments.
- The government plays a crucial role in promoting economic development through policies that encourage investment, entrepreneurship, and innovation.
- Regional disparities in economic growth persist in India, with some states showing higher levels of development than others. Addressing these disparities remains a significant challenge for policymakers.
GDP of Indian States UPSC
GDP of Indian states is an important topic for the UPSC Syllabus as it is a significant indicator of a state’s economic development. The exam often includes questions related to the GDP of various Indian states, their contribution to the national GDP, and their comparative economic performance over time. Aspirants are expected to have a good understanding of the factors that contribute to the economic growth of a state, such as infrastructure, natural resources, human capital, and government policies. They should also be familiar with the regional disparities in economic development and the measures taken by the government to address them.
You can check out the official StudyIQ UPSC Online Coaching website to gain a better understanding of how to prepare effectively for the UPSC exam it also provides the opportunity to practice the UPSC Mock Test for Prelims, which can help you assess your level of preparedness for the exam.


 India's Oil Import Dependency Reaches Re...
 Steel Production in India, Major Players...
 RBI issued New Guidelines regarding Liqu...


