Table of Contents
Population growth rates in Punjab have slowed significantly due to declining birth rates and fertility levels. This decline has not only reduced the state’s population growth over time but has done so at a sharper rate compared to the national average. According to the Economic Survey of Punjab 2022-23, the annual population growth rate in Punjab between 2001 and 2011 was 1.4%, lower than the national average of 1.8%. As of 2020, the fertility rate in Punjab is 1.5, compared to 2.0 for India as a whole.
These demographic trends have led to a noticeable shift, with a growing proportion of Punjab’s population falling into the working-age group (15–64 years). However, this shift presents two challenges:
- A larger working-age population does not inherently lead to economic growth unless accompanied by adequate skilling and employment opportunities.
- With a rising share of older adults, the state will need to allocate resources to healthcare and social security systems to support its growing dependent population.
General Population Statistics
| Year | Population | Male | Female | Sex Ratio | Child Population | Child Sex Ratio | Literacy Rate |
| 2011 | 27,743,338 | 14,639,465 | 13,103,873 | 895 | 3,076,219 | 846 | 75.84% |
| 2001 | 24,358,999 | 12,985,045 | 11,373,954 | 876 | 3,171,829 | 798 | 69.65% |
District-Wise Population Statistics (2011 Census)
| District | 1991 Population | 2001 Population | 2011 Population |
| Amritsar | 1,697,300 | 2,157,020 | 2,490,656 |
| Barnala | 440,800 | 526,931 | 595,527 |
| Bathinda | 985,300 | 1,183,295 | 1,388,525 |
| Faridkot | 455,000 | 550,892 | 617,508 |
| Fatehgarh Sahib | 455,300 | 538,470 | 600,163 |
| Gurdaspur | 1,756,600 | 2,103,455 | 2,298,323 |
| Hoshiarpur | 1,299,300 | 1,481,292 | 1,586,625 |
| Jalandhar | 1,649,900 | 1,962,761 | 2,193,590 |
| Ludhiana | 2,428,400 | 3,032,831 | 3,498,739 |
| Patiala | 1,344,900 | 1,584,780 | 1,895,686 |
Religious Composition
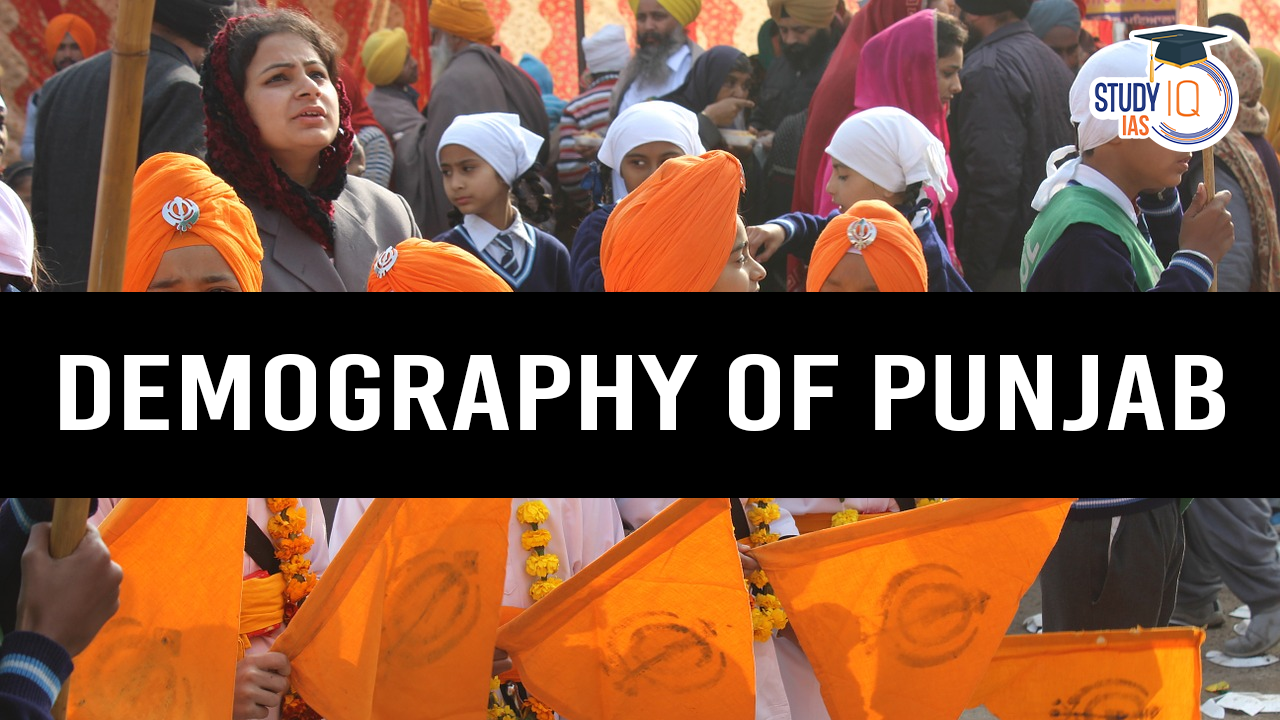
Punjab is unique as India’s only Sikh-majority state, with approximately 57.69% of the population adhering to Sikhism. Hinduism is the second most prevalent religion in the state,
| Religion | Population | Percentage |
| Sikh | 16,004,754 | 57.69% |
| Hindu | 10,678,138 | 38.49% |
| Muslim | 535,489 | 1.93% |
| Christian | 348,230 | 1.26% |
| Jain | 45,040 | 0.16% |
| Buddhist | 33,237 | 0.12% |
| Other Religion | 10,886 | 0.04% |
Urban and Rural Distribution
Punjab’s population is distributed across urban and rural areas, with the majority residing in rural regions. Urban areas account for 37.48% (10,399,146 people), while rural areas make up 62.52% (17,344,192 people). Urban regions show higher literacy (83.18%) but lower sex ratios compared to rural areas, reflecting distinct demographic patterns.
Urban Population: 10,399,146 (37.48%)
- Sex Ratio: 875 females per 1,000 males
- Child Sex Ratio: 852 girls per 1,000 boys
- Literacy Rate: 83.18%
Rural Population: 17,344,192 (62.52%)
- Sex Ratio: 907 females per 1,000 males
- Child Sex Ratio: 844 girls per 1,000 boys
- Literacy Rate: 71.42%
Literacy
Literacy rate refers to the percentage of individuals aged seven years and above who can read and write with understanding in any language. Literacy is a crucial indicator of a region’s educational development and social progress. In Punjab, the overall literacy rate stands at 75.84%, with males at 80.44% and females at 70.73%.
- Overall Literacy Rate: 75.84% (Males: 80.44%; Females: 70.73%)
- Total Literates: 18,707,137 (Males: 10,436,056; Females: 8,271,081)
Migration
Migration remains a defining characteristic of Punjab’s population and economy. The state ranks 8th in India in terms of migrant population, with over 24 lakh people from other states migrating to Punjab, according to the 2011 Census. This accounts for 5.3% of the total internal migration in India. A majority of these migrants (55.2%) were women. Ludhiana and SAS Nagar emerged as the primary destinations for immigrants within the state.
Comparative Demographics: India vs Punjab
| S. No | Parameter | India (States) | Punjab (Districts) | Remarks |
| 1 | Population | 121 Cr (1,21,05,69,573) | 2.77 Cr (2,77,43,338) | – Punjab contributes 2.29% of India’s population. – Population Rank: 16th – 13.89% Decadal Growth |
| Male | 62.31 Cr | 1.46 Cr | ||
| Female | 58.74 Cr | 1.31 Cr | ||
| Highest Population | Uttar Pradesh (19.98 Cr) | Ludhiana (16.21 Lakh) | ||
| Lowest Population | Sikkim (6.10 Lakh) | Barnala (2.78 Lakh) | ||
| 2 | Density | 382/km² | 551/km² | – Punjab’s density increased by 17.64%. – Density Rank: 6th (excluding UTs). |
| Highest Density | Bihar | Ludhiana (978/km²) | ||
| Lowest Density | Arunachal Pradesh | Muktsar (368/km²) | ||
| 3 | Total Area | 3.287 million km² | 50,362 km² | – Punjab covers 1.53% of India’s total area. – Area Rank: 19th (excluding UTs). |
| Largest (Area-Wise) | Rajasthan | Ludhiana | ||
| Smallest (Area-Wise) | Goa | Mohali | ||
| 4 | Literacy Rate | 74% | 75.84% | – Punjab Literacy Rate: a) Males: 80.44% b) Females: 70.73% – Literacy Rank: 14th |
| Highest Literacy Rate | Kerala | Hoshiarpur (84.6%) | ||
| Lowest Literacy Rate | Bihar | Mansa (61.8%) | ||
| 5 | Sex Ratio | 940/1000 | 895/1000 | – Sex Ratio Rank: 26th |
| Highest Sex Ratio | Kerala (1084) | Hoshiarpur (961) | ||
| Lowest Sex Ratio | Haryana (879) | Bathinda (868) | ||
| Sex Ratio (0–6 Age) | 914 | 846 |
In summary, Punjab’s demographics between 1971 and 2011 highlight dynamic changes driven by socio-economic, historical, and environmental factors. These trends provide key insights into population growth, religious composition, literacy, urbanization, and rural dynamics, shaping the state’s developmental trajectory.
| Punjab PCS Important Links | ||
| Punjab PCS Notification | Punjab PCS Apply Online | Punjab PCS Syllabus |
| PPSC Eligibility Criteria | PPSC PYQ | Punjab PCS Notes |

 Punjab PCS Selection Process, Prelims, M...
 State Universities of Punjab


