Table of Contents
What was the Agri Sector Growth Performance?
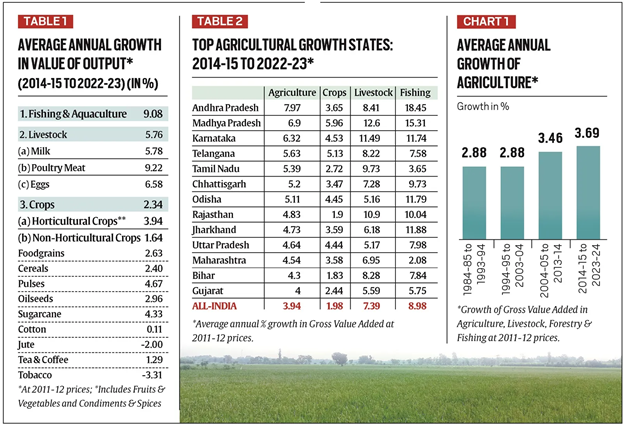
- From 1984-85 to 1993-94 and 1994-95 to 2003-04, agriculture’s annual growth rate, based on Gross Value Added (GVA) at constant prices, averaged 9%.
- Growth accelerated during 2004-05 to 2013-14 to 5% annually and further increased to 3.7% during 2014-15 to 2023-24.

| What is the Current Status of the Indian Agriculture Sector? |
|
Discrepancies in Output Estimates
- While official production estimates show significant growth, discrepancies have been noted between cereal production and household consumption data:
- Cereal production rose from 2 million tonnes (mt) in 2004-05 to 303.6 mt in 2022-23.
- However, household cereal consumption has remained almost flat at 153-156 mt over the same period.
- The gap between production and consumption increased from 5 mt in 2004-05 to 151 mt in 2022-23.
- Similar discrepancies exist in milk production, which more than doubled from 92.5 mt in 2004-05 to 230.6 mt in 2022-23, without a matching increase in consumption.
Subsector Performance: Disaggregated Data
- Crops subsector (regular farming) recorded only 2.3% annual growth during 2014-15 to 2022-23, which is lower than the 3.4% growth during the UPA period.
- Livestock and fisheries sub-sectors performed significantly better with:
- Livestock growing at 8% annually.
- Fisheries growing at 2% annually from 2014-15 to 2022-23.
- Within livestock and fisheries, specific areas showed even higher growth:
- Poultry meat: 2%
- Fishing & aquaculture: 1%
- Eggs: 6%
- Milk: 8%
- Even within crops, horticulture performed well, growing at 9% annually.
- However, non-horticulture field crops like cereals, oilseeds, and cash crops (cotton, jute, tobacco) showed sluggish growth:
- Regular field crops grew by just 1.6%
| Schemes and Initiatives |
e-NAM Scheme (Electronic National Agriculture Market)
Farmer Producer Organizations (FPOs) Scheme
Minimum Support Price (MSP)
Pradhan Mantri Kisan Maandhan Yojna (PMKMY)
PM Programme for Restoration, Awareness Generation, Nourishment, and Amelioration of Mother Earth (PM-PRANAM)
Pradhan Mantri Fasal Bima Yojana (PMFBY)
|
Policy Takeaways and Market-Led Diversification
- Diversification in agriculture has been market-driven, driven by increased demand for vegetables, fruits, milk, meat, eggs, and fish, resulting in accelerated agricultural growth.
- Diets have diversified from calorie-heavy to protein-rich foods.
- New technologies like hybrid seeds, drip irrigation, and improved livestock breeds have facilitated this shift.
- However, not all farmers have benefited equally:
- Only 53% of farmers engage in livestock
- Only 5% cultivate horticulture crops.
- A significant portion (2%) of farmers still rely on conventional crop farming (cereals, pulses, oilseeds, etc.).
- There has been no significant technological breakthrough in crops like cotton since the introduction of Bt hybrids, and India’s domestic production of cotton has stagnated.
Concluding Observations
The modest growth in field crops like rice and wheat, despite being covered under the Minimum Support Price (MSP) regime, underscores the importance of demand-side factors and production technology improvements over price or subsidy interventions.


 SHANTI Bill 2025: India Opens Nuclear Se...
 Revamp of MGNREGA Scheme 2025
 National Energy Conservation Awards 2025


